Dashboard
Dashboard Description
The Dashboard will be the main screen for RemoteFieldView. The dashboard displays all vehicle information at a glance. The devices(vehicles) shown will vary per user. Each user can have different groups assigned, and will only be allowed to view those specific groups. As a default, the Admin user assigned to your company will have access to all devices.
To keep your Dashboard refreshing data constantly, please see the top right hand section of this page.
We will allow the screen to refresh every 30 seconds. Each time a session is opened, you must click on Maintain Timer running for this session and the timer will run until you log off.
You can change view to one specific group or all.
Dashboard Tiles
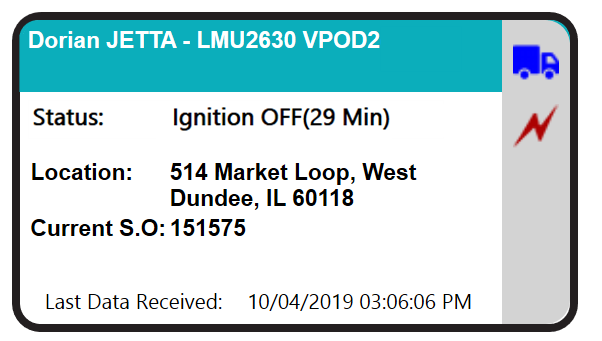
The dashboard board will consist of "Tiles" for each device. It will contain the latest information of the device, including location, status, and current Service Order.
Each tile will show the following data:
- Vehicle Description and Vehicle Code
- Custom. These can be modified in Device Maintenance at any time.
- Device Status
- Ignition Status On/Off
- Idling
- Towing
- Moving/Driving
- Device Location
- Ignition and Idling Events will always show the closest address available.
- Address of location. While the vehicle is in motion, address location may only show street names.
- Current S.O.
- Will show most current Service Order assigned to that device.
- Timestamp of last Data Record Received from Device.
- Assigned Vehicle Icon
- Icon Assigned to Device. Can be modified in Device Maintenance.
- Ignition Status Icon
- Lightning Icon
- Green - Ignition On
- Red - Ignition Off
- Yellow - Idling
- Lightning Icon
- Garmin Status (If Garmin Device is used)
- Will show if the Garmin power status
- Green - Garmin is online
- Red - Garmin is offline
- Gray with Red Icon - Garmin is Disconnected
- Will show if the Garmin power status
Device Details
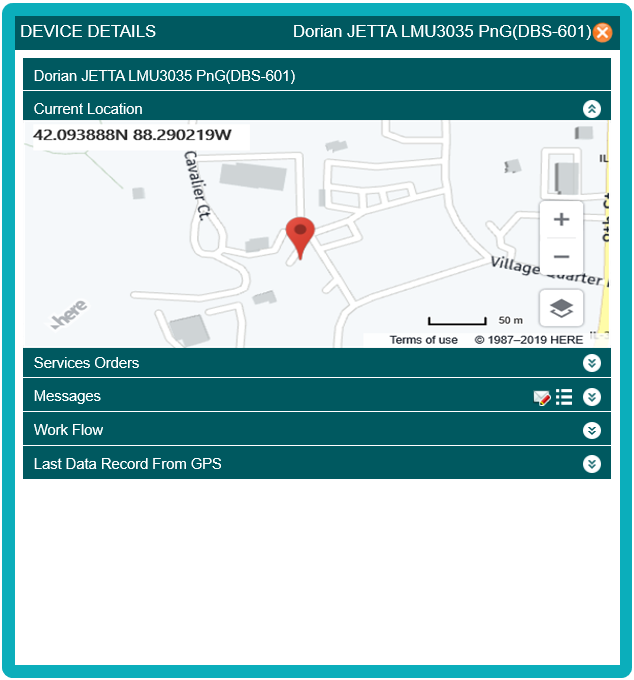
Each tile can provide more details of the device. This data is accessed by clicking on individual device tiles.
When you click on a tile, the following pop-up menu is displayed:
The Details pop-up window will allow you to review the vehicles data on the same screen, without having to navigate elsewhere. This window will allow you to scroll down to different sections and allow you to expand and retract each section. Each section can be expanded and retracted by clicking the arrow icons on the top right of each section.
This window will provide the following sections of information:
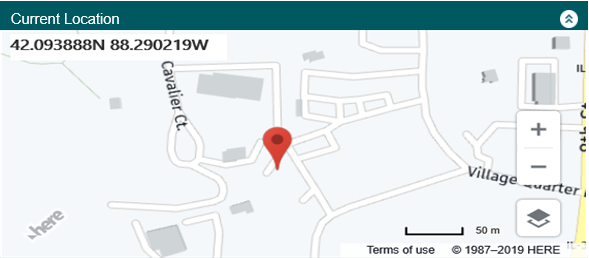
- Current Location – Displays an interactive map that you can zoom in and out of, showing the location of the device using the designated vehicle icon.
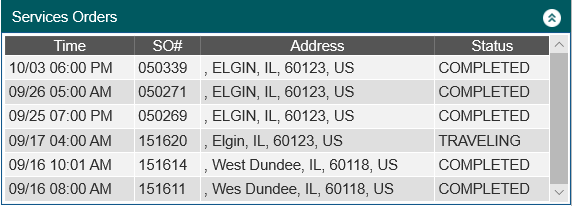
- Service Orders – Displays the list of Service Orders that have been sent to this device.
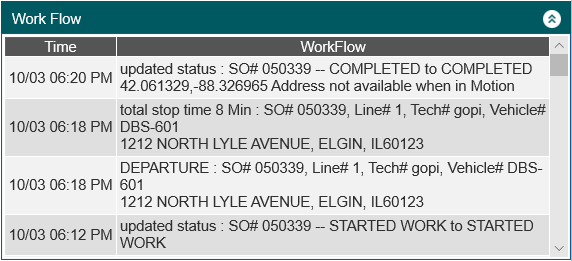
- Work Flow – Displays Work Flow for the Device.
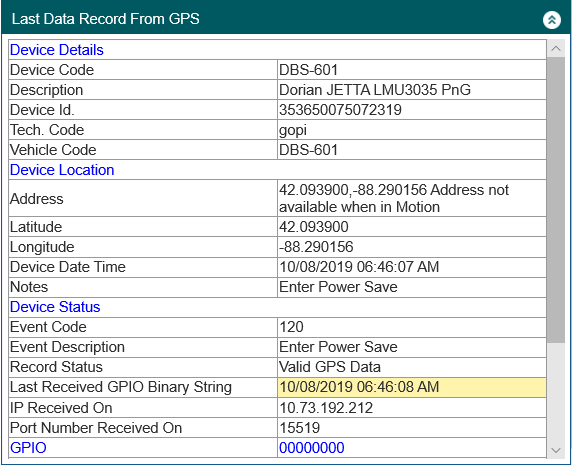
- Last Data Record from GPS – Displays the last data record received from the device. This includes, Device information, Device Location, Device Status, GPIO Information, and Garmin Status.
To exit this window, click on the “X” icon on the top.
The next sections to cover are Administration, to configure users, user access, menu access and Device access. Please go to the Administration section to continue.
If you wish to continue learning basic navigation, please go to the Daily Processing section.


